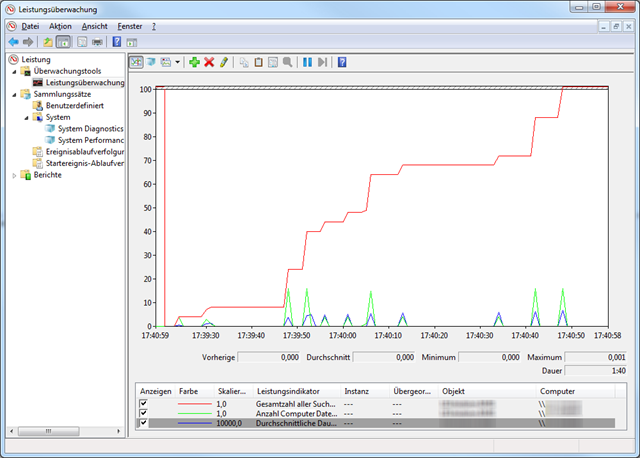
For the current project I am working on, I recently had to implement a way of easy adding and using Performance Counters in .NET. While working on the code base, I implemented various counters as examples how to use the new infrastructure and how to implement counters in the code base.
While investigating in performance counters, I’ve seen quite a series of posts and articles describing the usage of the AverageTimer32 and AverageTimer64 classes. However, all the examples there seemed to be wrong. One of these examples was a question I have answered on stackoverflow.com, leading to this post.
Basically, all the examples I have seen propose to throw a set of measurements into the mentioned expecting that the counter provides the average of these measurements. The AverageTimer32/64, however, does not calculate the average of all measurements you perform. Instead it provides the ration of your measurements to the number of operations you provide.
To understand how the AverageTimer32/64 works, it might be helpful to understand the formula behind it. This also answers why one needs an AverageBase to use an AverageTimer32/64.
The formula the AverageTimer32/64 is based on is as following:
((N1 - N0) / F) / (B1 - B0)
given
N1 current reading at time t (provided to the AverageTimer32/64)
N0 reading before, at t – 1 (provided to the AverageTimer32/64)
B1 current counter at t (provided to the AverageBase)
B0 counter before, at t – 1 (provided to the AverageBase)
F Factor to calculate ticks/seconds
In a nutshell the formula takes the current time in ticks and subtracts the previous one provided. The result divided by the factor F gives you the time you operation run since the last measurement taken at t-1. Usually, this factor should be 10.000.000 ticks per second.
Now you divide this by the current base counter minus the previous base counter provided. Usually, this might be one. As a result you have the average time of your operation for a single measurement.
Using the AverageBase you now can step over various measurement points. Think of a case where you can set the counter only every tenth operation you perform. Since your last measurement you would increment the AverageTimer32/64 by the new time measurement for all ten operations while incrementing the AverageBase by ten. Eventually, you will receive the average time for one operation (even if you have measured over all ten operation calls).
In most examples, a set of timespans are provided for this counter to calculate an average value. Let this be a series of numbers like 10, 9, 8, 7 ,6 while increasing the AverageBase by 1 every time providing one of these figures.
For the second measurement you will receive the following result:
(9 – 10) / F / (1 – 0) = -1 / F / 1
With F being 1 for simplicity you will get -1 as result. Given measurements that provide most of the time similar results, for a large number of experiments you will end up with am average value near zero.
Based on the previous example, the correct values to submit, however should be 10, 19, 27, 34, 40. Again the same example we will show a different result.
(19 – 10) / F / (1 – 0) = 9 / F / 1
With F being 1 again, you will have an average time of 9 for your second measurement. As you can see from the formula, the every value measured needs to be greater than the previous one to avoid the effect previously showed.
You might use a global Stopwatch to achieve this goal. Instead of starting it new, you might use use Start() – not Restart() for each measurement. As seen above, the counter will calculate the difference time internally. That way you will get correct measurements.
public void Compute()
{
    _stopwatch.Start(); // do not restart the Stopwatch used for average counters


    // code to be measured
    // ...


    _stopwatch.Stop();


    _avgTimeCounter.IncrementBy(_stopwatch.ElapsedMilliseconds);
    _avgTimeCounterBase.Increment();
}
Even if called AverageTimer32/64, this type of counter is not strictly restricted to time. You can think of using this counter for a variety of measurements. For example 404 responses in relation to the total number of HTTP requests, disk transfer rations and so on.

Oded